' fill='none' stroke='%23304560' stroke-miterlimit='10' stroke-width='2'/%3e%3c/svg%3e)

Genetic correlations, what are they, and why do we need them?
Dr. Valérie Poupon
08 December 2023
Linear mixed models offer a powerful and flexible framework for a wide range of statistical analyses. They make it possible to model simple or complex data structures and consistently obtain reliable estimates. To make valuable decisions in breeding, in addition to obtaining variances components, BLUEs, and BLUPs estimations, it is often relevant to evaluate the correlations existing between traits (Type A) or between environments (Type B). Thus, methods have been developed to estimate such correlations using linear mixed models. As we delve into today’s blog, our focus will be to understand and learn how to interpret these two critical concepts.
Trait-to-trait genetic correlation: Type A
Type A correlation refers to the genetic correlation between two traits. In other words, it corresponds to the shared proportion of variance between two traits resulting from genetic causes. Two traits are genetically correlated when one or more gene loci are pleiotropic. That is, when one or more gene loci are influencing the expression of both traits simultaneously. Furthermore, we can separate this correlation into its broad-sense component (obtained when working with clonal data) and its narrow-sense additive component (that is often estimated using pedigree data).
All correlation values can range anywhere from -1 to 1. A correlation near -1 indicates that, based on the sampled data, there is a strong negative relationship between the traits. On the other hand, a correlation near 1 indicates a strong positive relationship between the two traits. That said, the sign of the correlation is determined by the units and definition of the variables used to quantify the traits. For instance, in a study where tree height would be negatively correlated with the susceptibility to a disease, if the scale was reversed and disease resistance was considered instead of disease susceptibility, the correlation would then be positive. A correlation near 0 however, indicates that, based on the studied sample, both traits are governed by different genes.
In breeding, knowing that two traits are genetically correlated can have great value, and this information can be used for several different purposes. For instance, multivariate analyses can improve the precision of the estimated breeding values for both traits. Additionally, when two traits are strongly correlated, one trait can be used as a proxy for indirect selection of the other trait, especially when one of the traits is more difficult, or expensive, to sample. However, in some cases, a strong genetic correlation between traits can be problematic, when an improvement in performance in one trait is associated with a decreasing performance in another.
Site-to-site genetic correlation: Type B
Type B correlation corresponds to the genetic correlation of the same trait across two or more environments or locations and it is often used as a measure of genotype-by-environment interaction (GxE). As for Type A correlation, the values can range from -1 to 1; and we can separate it into the broad-sense genetic component (clonal data) and the narrow-sense additive genetic component (pedigree data).
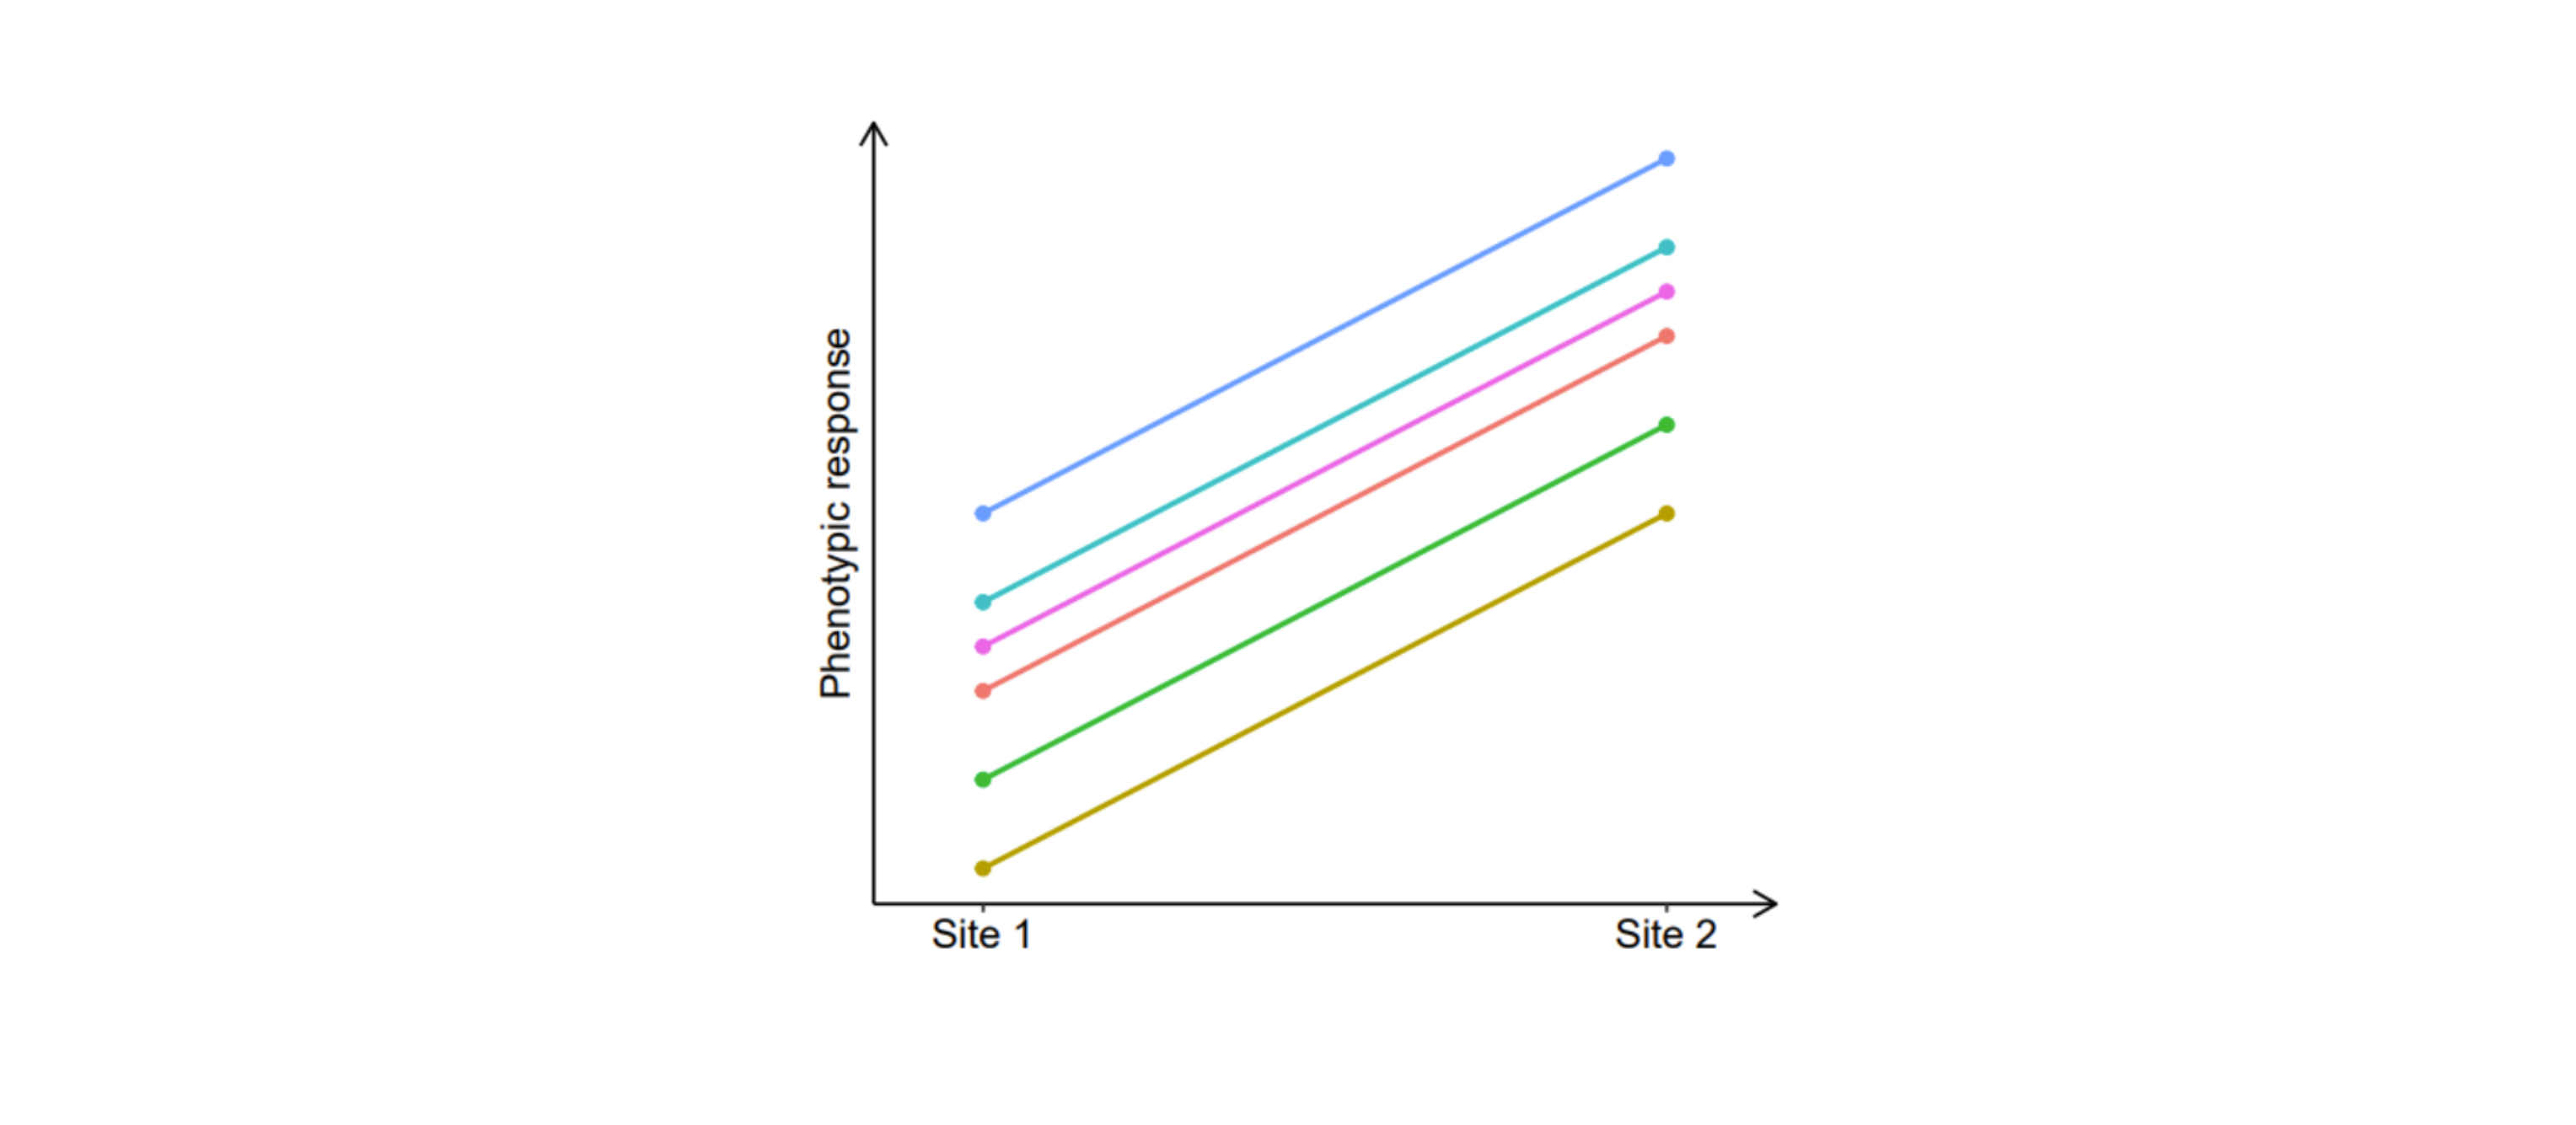
When the relative performance of several genotypes remains more or less constant across sites, that is when their gene expression is similar or varies similarly, then we estimate a genetic correlation close to 1. High positive correlations are indicative of a low GxE, with a strong agreement in genotypic ranking and performance differences between different environments. A graphical representation is shown below:
 On the other hand, when a set of genotypes responds to environmental variation in a differential way, with diverging gene expression patterns, the correlation is lower than 1 and this indicates the presence of GxE. When the correlation is 0, it indicates that there is no association between the relative performance of the genotypes between the environments. When the correlation is -1, the genotypes that perform the best in one environment perform the worst in the other (and vice versa). A correlation near 0 (plot on the left) and a correlation of -1 (plot on the right) are graphically represented as shown in the figures below:
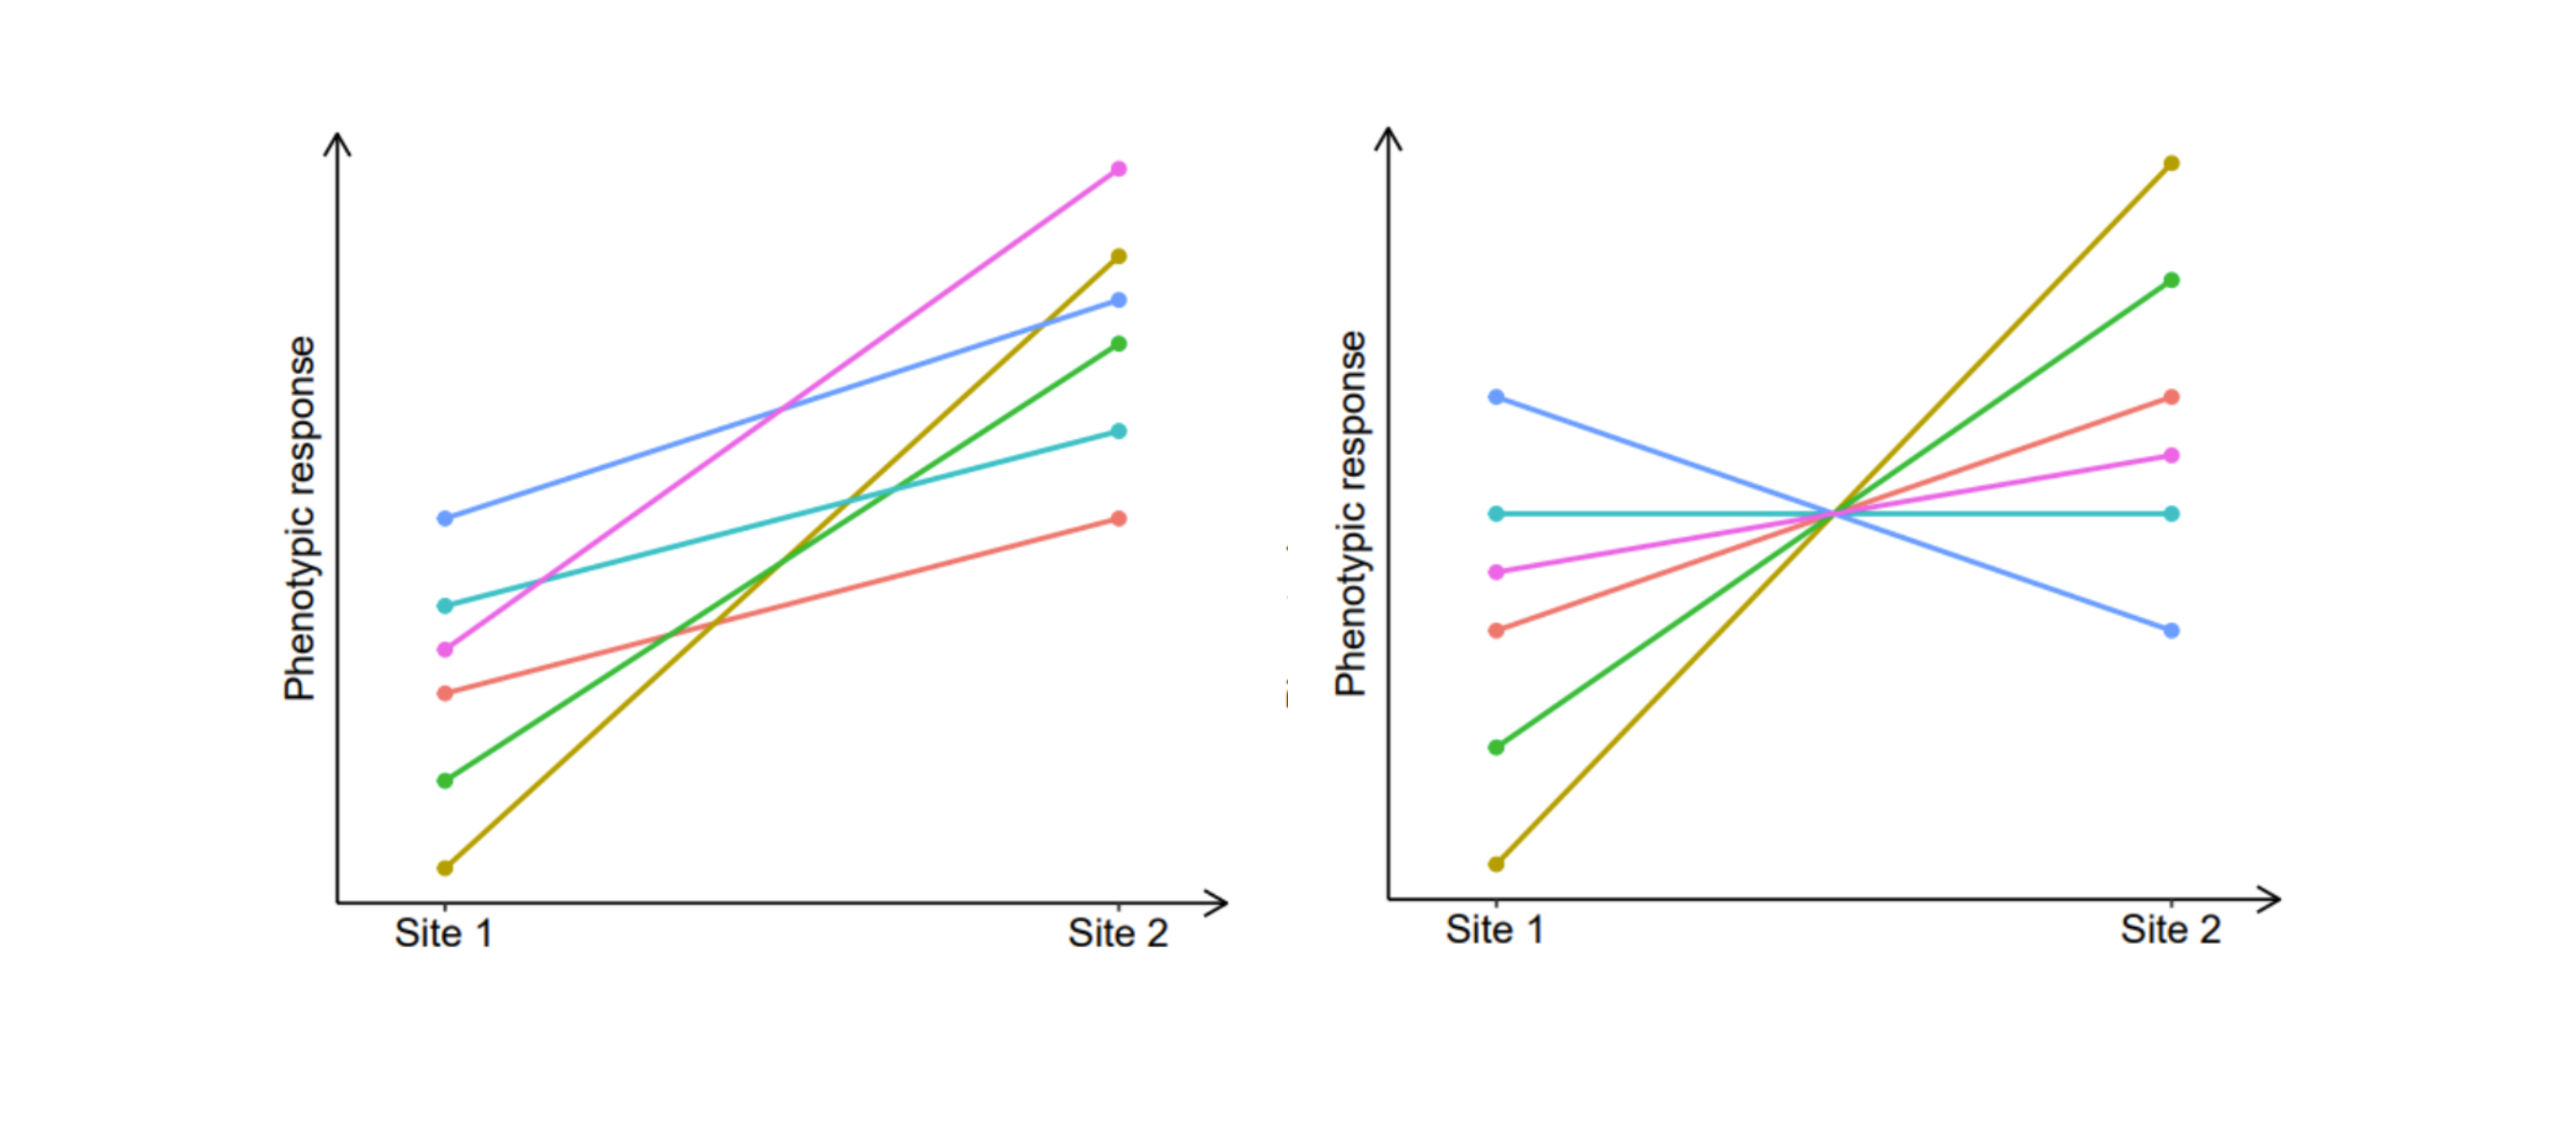 As a result of GxE, individuals performing well in one environment may perform poorly in another. This concept has considerable implications in breeding. It is the reason why testing individuals in different environmental conditions is often required. Understanding the genetic correlation between environments, locations or even seasons can significantly optimize the selection process. For instance, in plant and tree breeding, establishing breeding zones is based on grouping areas with similar climatic conditions and selecting genotypes that are similarly adapted (i.e., high genetic correlations), so that, within the same zone, the selected genetic material can be deployed anywhere with a low risk of maladaptation.
Statistical Modeling
Models to obtain genetic correlations are not easy to fit. They need high-quality data with a large number of sampled individuals that are balanced across families (or clones) and, for Type B correlations, across testing environments. Additionally, estimating these correlations requires the use of specialized software, such as SAS, SPSS, ASReml-R, and Genstat. ASReml-R for instance, can be used to fit several types of complex variance structures to obtain correlations between several traits, multiple sites, as well as a combination of the two. When fitting a linear mixed model to obtain the genetic correlation between two traits, the variance-covariance structure required is usually of the form:
where  and
and  are the genetic variance components associated with traits 1 and 2, respectively; and
  is the genetic covariance between traits. Once the components are estimated, the Type A genetic correlation
  is calculated using the following formula:
Note that, depending on the software used, the model can provide a covariance, or will internally calculate and render a correlation.
Final Remarks
In summary, both types of genetic correlations have significant implications, and understanding them is essential for all breeding programs. Strong Type A correlations, either positive or negative, will help a breeding program to decide, amongst other things, which variables to focus on, and the implications of indirect selection on other traits. For Type B correlations, large positive correlations imply the presence of low levels of GxE with a consistent ranking of genotypes across environments. This will translate into simplified breeding programs where selected superior individuals are more likely to respond well across the whole breeding zone. Hence, trait-to-trait and site-to-site genetic correlations are critical components to consider when establishing efficient breeding strategies.
Find out more about…
• Using genetic correlations to improve the University of Florida's strawberry breeding program
• The G×E interaction phenomenon
About the author
Dr. Valérie Poupon is a quantitative geneticist with a Ph.D. in Genetics and Tree Breeding from the Czech University of Life Sciences (CULS). She currently works as a Statistical Consultant at VSN International, UK. She has experience in quantitative genetics and field trial analysis, with multi-trial and multi-trait data.

Popular


Related Reads