Competitive Genetics: Exploring the impact of direct and indirect genetic effects in tree breeding
Dr. Filipe Manoel Ferreira & Saulo Chaves & Dr Kaio Olimpio
22 February 2024
Imagine a group of caged animals where everyone has it's own set of abilities to acquire food. Among them, there is a notably competitive animal named Max. Max is driven by a strong desire to outshine his companions, particularly when it comes to securing a limited food resource within the cage. In this confined space, Max competitive nature tends to create a stressful environment, negatively affecting the access to food of his cage mates.
This metaphor helps us to understand two central concepts in competition modelling. The first is the Direct Genetic Effect (DGE) which is how much an individual’s genes can influence its own trait performance. That is, Max’s competitive nature and his ability to acquire enough food. The second is the Indirect Genetic Effect (IGE), also known as the genetic competition effect, which is the impact that the genes of one individual have on the performance of another individual. In this case, the negative effect of Max on his cage mate’s diet.
In tree breeding, just like in the cage, both DGE and IGE are actively contributing to the observed performance. Therefore, the competition effect provides further information to select superior genotypes. Competition is expected to be common in nature and potentially impacts the magnitude and direction of the response to selection in breeding. Therefore, how can we evaluate the genetic competition effects in a tree breeding trial?
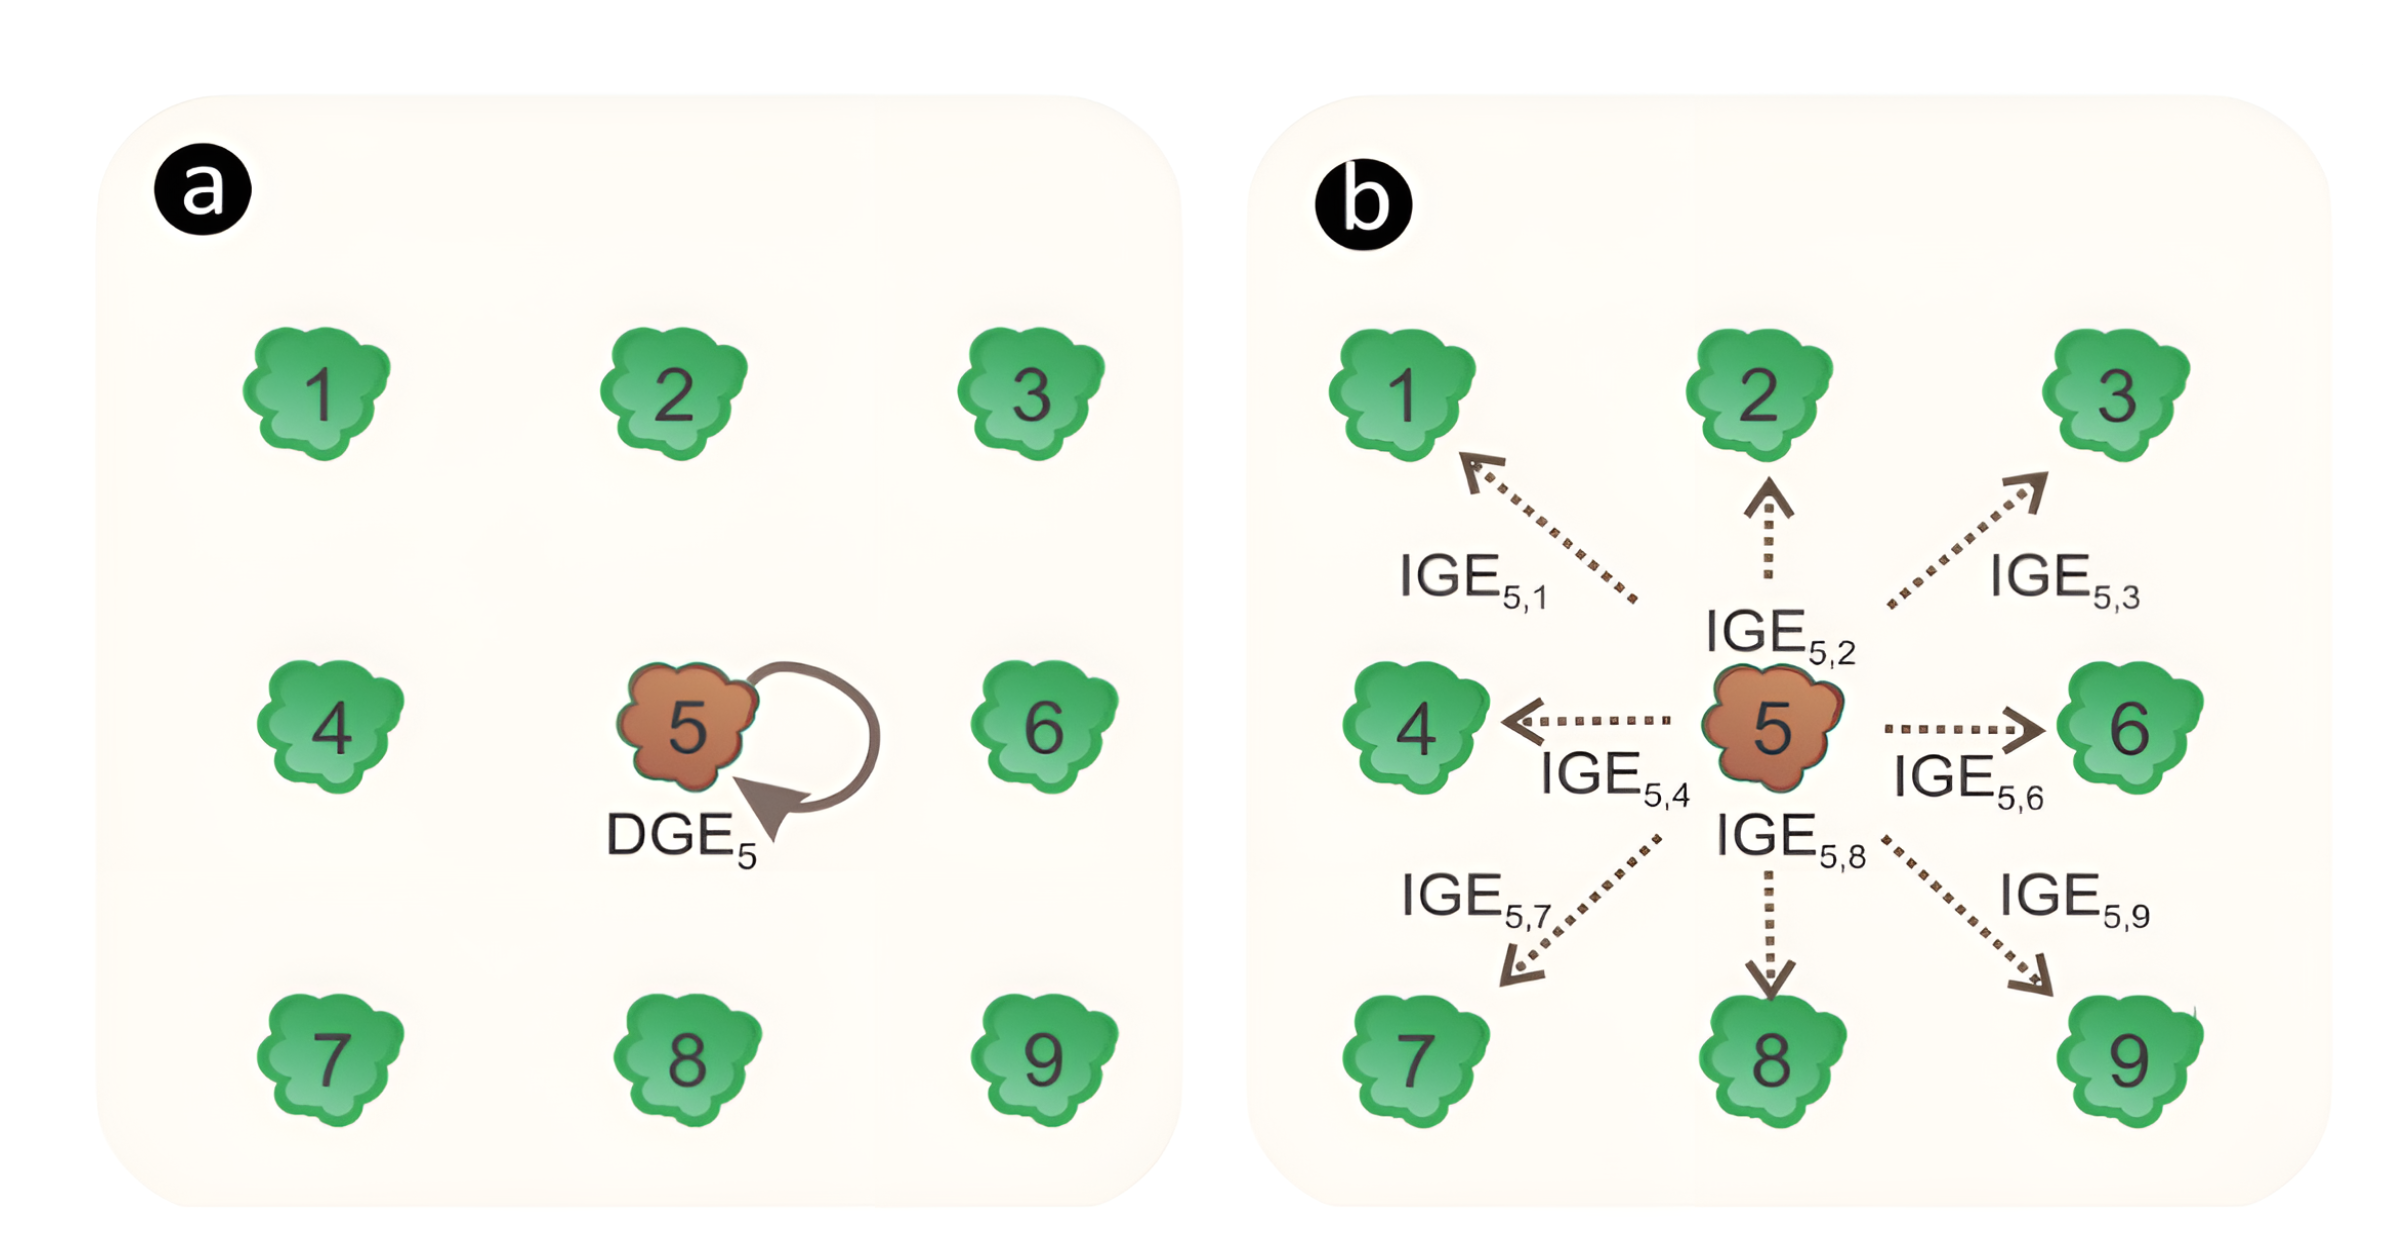
In a statistical genetic competition model, the trees’ genetic value is divided into DGE and IGE. The DGE of a given tree will be reflected in its own phenotypic performance (Figure a), while the IGE of the same tree will only be perceived in the phenotype of its neighbours (Figure b). Therefore, the total heritable variation that determines the potential of a population to respond to selection depends on the magnitude of both DGE and IGE, and how they are correlated.  Figure adapted from Ferreira et al. (2023): Illustration of (a) direct genotypic effects (DGE) of the focal tree 5 affecting its own phenotype; and (b) mean indirect genotypic effect (IGE) of the focal tree 5 on its neighbors, affecting their phenotype.
To simplify, we can think of trees with high IGE as more aggressive, i.e. holding a greater capacity to negatively affect the phenotypic performance of their neighbours. On the other hand, low IGE trees can be viewed as the passive ones: they have a reduced capacity to negatively affect the phenotypic performance of their neighbours. The correlation between DGE and IGE depends on various factors, such as the evaluated trait, the kinship between the focal tree and its neighbours, and resources availability.
Let’s do an example to tie these concepts together. To incorporate the genetic competition effects into a linear mixed model, we must first build a competition matrix, . This matrix will be composed of the competition intensity factors, computed using the competition indices proposed by Costa e Silva and Kerr (2013). These factors consider the physical planting distance between trees and the number of neighbours in row, column, and diagonal directions. The equations are detailed in Costa e Silva and Kerr (2013) and a practical example can be found in Ferreira et al. (2023).
In the toy example below, we consider an inter-row/inter-column distance of 2.5 × 3 meters. Each row of corresponds to a plot and each column to a genotype. By filling the first row, we are focussed on plot 1, which corresponds to one replicate of genotype G4. This genotype is neighboured by genotypes G5 in the row, G6 in the column, and G7 on the diagonal. Therefore, the corresponding competition intensity factors will be added on the cells corresponding to G5, G6, and G7. Note that, the greater the distance between the focal tree and its neighbour, the lower the magnitude of the competition intensity factors. The remaining cells will receive 0. We repeat this process for all plots until we fill all rows of the matrix. will act as the IGE incidence matrix in a linear mixed model. The DGE incidence matrix will be the , which is built as a standard incidence matrix: each row will have 1 in the cell that corresponds to the genotype in the plot, and 0 for the remainder.
(a) Schematic illustration of the toy example’s randomized complete block trial. Each form represents a tree, and each colour represents a genotype. The code below the trees is the plot number. The dashed line marks the block division; (b) matrix built for the toy example; and (c) matrix built for the toy example.
The genetic competition linear mixed model for the data from the toy trial is:
where is the vector of phenotypes, is the portion of the model corresponding to the fixed effects, is related to the DGE, refers to the IGE, and e is the vector of residual effects. One may also consider competition at the residual level by modelling with, for example, a two-way autoregressive structure. This structure can be used to identify trends in the residuals by considering correlations among neighbouring plots, which might not be explained by the other effects. This refinement can improve the model's accuracy in capturing data variation.
To fit this model in ASReml-R, we must declare in the code. To do so, we will use the grp() model term function (for details on the usage of grp(), refer to the ASReml-R manual).
data <- cbind(Zc, data)
mcomp <- asreml(fixed = y ~ block,
               random = ~ gen + grp(g1),
               group = list(g1 = 1:ncol(Zc)),
               data = data)
To fit a model that considers a covariance between DGE and IGE, the code needs to be modified as shown below. Here the function str() helps to assign variance structures to more than one random term:
mcomp <- asreml(fixed = y ~ block,
               random = ~ str(~gen + grp(g1), ~corh(2):id(gen)),
               group = list(g1 = 1:ncol(Zc)),
               data = data)
Finally, a spatial-genetic competition model is fitted using the following code. Note that we used the two-way autoregressive structure, represented by ar1():ar1().
mcomp <- asreml(fixed = y ~ block,
               random = ~ str(~gen + grp(g1), ~corh(2):id(gen)),
               group = list(g1 = 1:ncol(Zc)),
               residual = ~ar1(row):ar1(col),
               data = data)
This model provides variance components for DGE and IGE, the correlation between DGE and IGE, and the auto-regressive residual terms [see the table below adapted from Ferreira et al. (2023)].
Variance components extracted from mcomp (using summary(mcomp)$varcomp). Adapted from Ferreira et al. (2023).

The statistical significance of DGE and IGE can be verified via likelihood ratio test (LRT). If the IGE are significant, fitting a model only with DGE is possibly biased. When IGE is significant, the total genotypic value (TGV) is the most appropriate selection unit:
where , and is the mean number of neighbours in the row, column, and diagonal directions, respectively; and , and are the mean competition intensity factors in the row, column, and diagonal directions, respectively. The TGV provides information on both the genetic merits and the competition capacity of a selection candidate.
The presence of competition has the potential to greatly affect the ranking of candidate genotypes and the potential response to selection of certain traits. Candidates selected based solely on DGE may not repeat their performance in other trials - or in commercial plantations - as their capacity to endure (or exert) competition was overlooked. In other words, disregarding IGE increases the risk of a flawed selection or recommendation. This has been attested in research, for example Ferreira et al. (2023). Their research demonstrated the significance of IGEs in influencing rankings, particularly as competition intensifies with advanced ages. The authors proposed a method akin to a head coach selecting a roster for the football World Cup to recommend a mixture of clones for plantations. It emphasizes the need for candidates to possess both individual talent and the ability to harmonize with their teammates. This method offers an alternative to explore competition, suggesting the recommendation of clones based on the trade-off between performance potential and competition capacity, being just one example of how breeders can explore and exploit competition effects.
In a nutshell: Boost your selection game — do not ignore the competition effects! In commercial settings trees will be surrounded by other trees, and their phenotypic expression will depend on how well they can outshine their leafy fellows.
Relevant References
Costa e Silva, J., Kerr, R.J., 2013. Accounting for competition in genetic analysis, with particular emphasis on forest genetic trials. Tree Genetics & Genomes 9, 1–17.
Ferreira, F.M., Chaves, S.F.S., Bhering, L.L., Alves, R.S., Takahashi, E.K., Sousa, J.E., Resende, M.D., Leite, F.P., Gezan, S.A., Viana, J.M., Fernandes, S.B., Dias, K.O., 2023. A novel strategy to predict clonal composites by jointly modeling spatial variation and genetic competition. Forest Ecology and Management 548, 121393
About the authors
Dr. Filipe Manoel Ferreira is a quantitative geneticist with extensive experience in tree breeding and statistical analysis. He currently serves as a postdoctoral student at the College of Agricultural Sciences, São Paulo State University, Brazil. Over the past three years, he has conducted short courses on quantitative genetics and statistical modeling for both companies and university researchers.
Saulo Chaves is an Ph.D. candidate in Genetics and Plant breeding at Federal University of Viçosa (UFV), Brazil. Focused on statistical genetics, he actively contributes to research on competition, genomics and enviromics, in both perennial and annual crops.
Dr Kaio Olimpio is a statistician/quantitative geneticist with more than 10 years’ experience in plant breeding, quantitative genetics, and statistical analysis. He currently works as an Assistant Professor at Federal University of Viçosa, Brazil.
Popular
Related Reads
